


🇺🇸
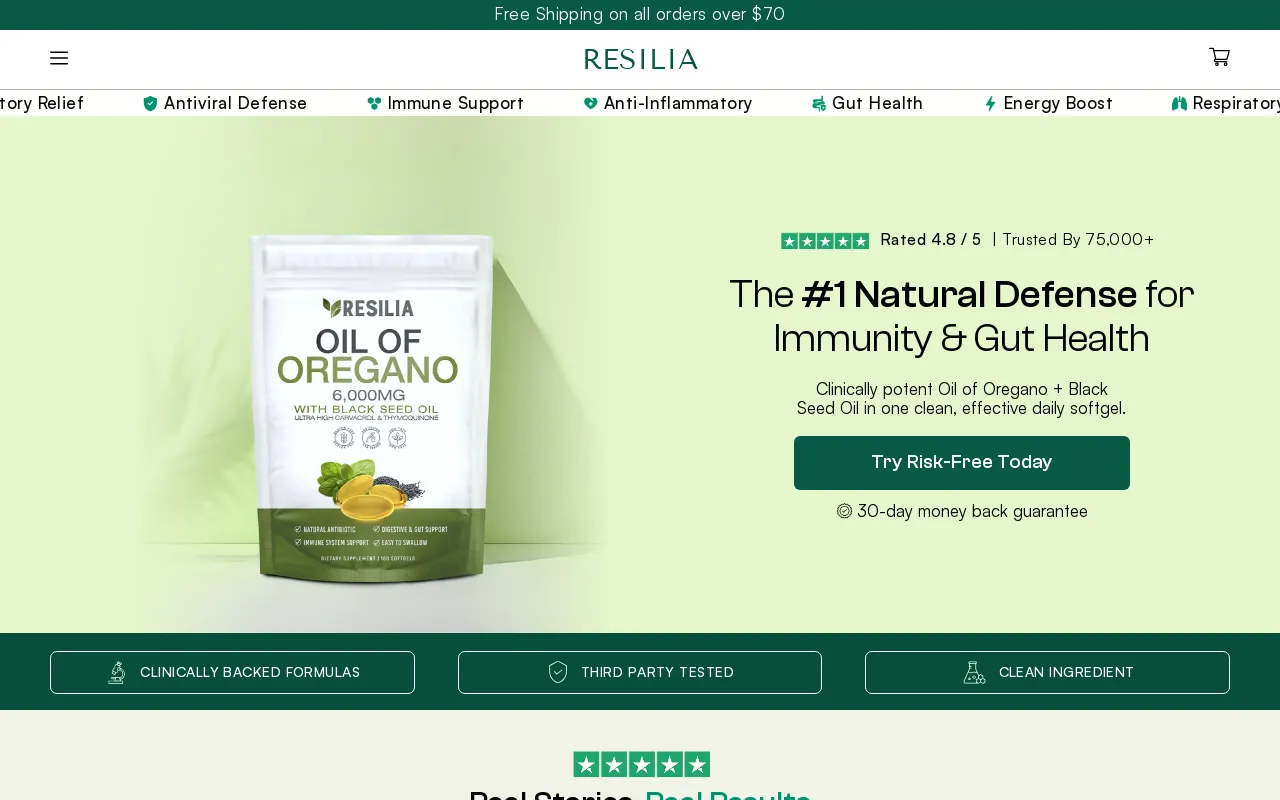
Resilia
Vitamins & Supplements
Mar 1, 20264.1Mtraffic
~$1.2M/day·$36.5M/mo
17active
66products
View full analysis





 Shopify app analysis
Boost eco-friendly eCommerce with trusted reviews and sales growth.
Out of 160 total stores. Real stores analyzed and verified by Brandsearch.

Where the 160 stores running Ryviu: Product Reviews & QA are based.


Which Shopify verticals over-index on Ryviu: Product Reviews & QA adoption.
More insights about markets, niches, and competitive apps used by successful stores.
Explore stores by country and analyze regional market trends across 10 countries.
Discover industry categories and niches where Ryviu: Product Reviews & QA performs best across 10 verticals.
Compare Ryviu: Product Reviews & QA with other popular Shopify apps and discover alternative solutions.
• 160 active stores trust this app for their business
• Generates 22.9M total monthly visits across all users
• Average of 143.4K monthly visits per store
• Strong presence in 10 countries worldwide
• Most popular in Apparel sector
• Used across 10 different industry verticals
• 68 stores in the United States
• Maintained 4.7 star rating from satisfied merchants
Everything you need to know about Ryviu: Product Reviews & QA
160+ Shopify stores are actively running Ryviu: Product Reviews & QA. The adoption spans niches and revenue brackets, from indie DTC brands to scaling 7- and 8-figure operations — a signal that the app delivers value across multiple stages of store growth. BrandSearch lets you filter the user base by niche, country and revenue tier to find stores comparable to yours. Source: BrandSearch tech-stack detection.
The highest-traffic and highest-revenue stores using Ryviu: Product Reviews & QA are surfaced on BrandSearch with their full intelligence profile. Stores adopting this app average 143,435 monthly visits. Each entry exposes products, pricing, marketing channels, ad creatives and revenue estimates — enough to reverse-engineer how successful brands integrate Ryviu: Product Reviews & QA into a working stack. Source: BrandSearch Brand Library, refreshed weekly for the top 10k stores.
Performance lift varies by niche and store size, but BrandSearch lets you compare stores using Ryviu: Product Reviews & QA against peer stores without it — same niche, similar traffic. Across the 160 tracked adopters you can observe traffic deltas, AOV signals and growth trajectories to assess real-world ROI for your context. Avoid relying on vendor case studies alone — they are cherry-picked. Source: BrandSearch comparative analytics.
BrandSearch ranks the most-adopted alternatives to Ryviu: Product Reviews & QA based on store overlap, niche fit, ratings and pricing. The alternatives view shows which app competitors stores tend to choose instead — and the migration patterns between them. Use this to evaluate trade-offs concretely before locking in your stack. Source: BrandSearch app adoption signals, covering 264+ tracked Shopify apps.
The right benchmark is not the vendor's pricing page — it is the performance of 160 real stores running Ryviu: Product Reviews & QA compared to your own profile. Match adopters by niche, country and revenue bracket on BrandSearch, then check whether their traffic, AOV signals and growth justify the app's monthly cost in your context. Decision driven by data, not by promised features. Source: BrandSearch peer benchmarking layer.
Top adopters typically use Ryviu: Product Reviews & QA as part of a broader recurring stack — combining it with email, reviews, upsell and analytics apps that complement its function. BrandSearch exposes the full stack of every tracked store, so you can see which app combinations the highest performers in your niche have converged on. Replicating proven stacks shortcuts months of testing. Source: BrandSearch tech-stack monthly refresh.
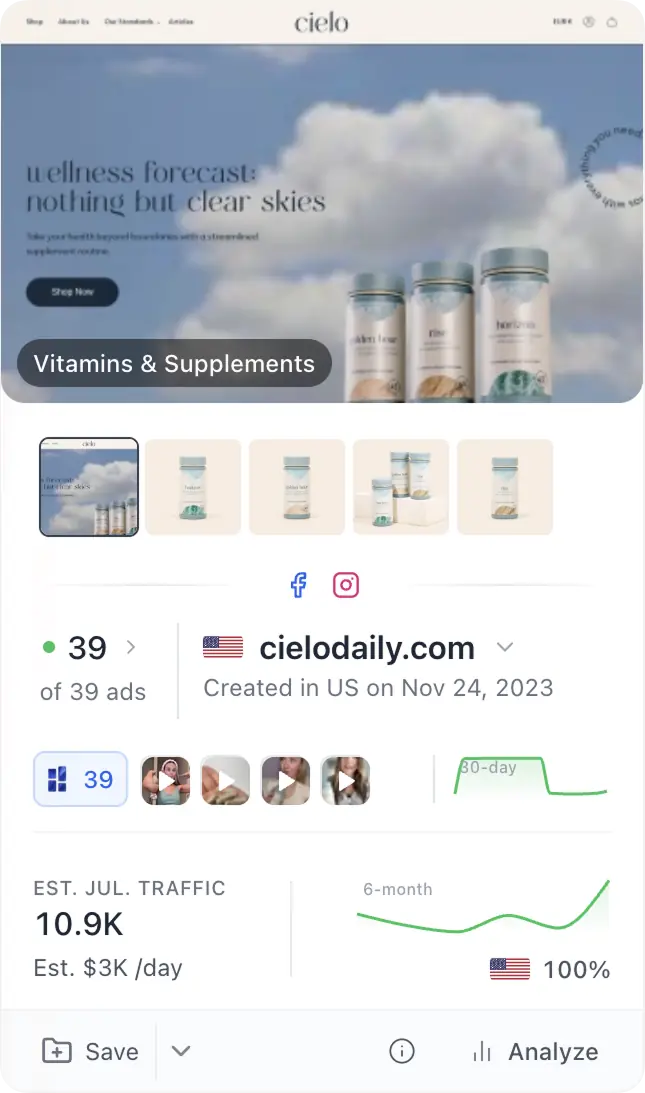
Find winning products and proven ad strategies in seconds. The all-in-one solution to stop guessing and start scaling your next brand.