Top 100 Trending eCommerce Niches — October 2025
Ranked by average monthly traffic per brand
Overview
477K average monthly visits. Only 13 brands. That's the kind of opportunity hiding in plain sight this month.
While most founders chase saturated categories, 57 niches below have fewer than 20 active brands yet maintain 100K+ average traffic per brand. This isn't theory—these are real brands, real traffic, real market validation.
Our monthly analysis of several thousand product categories reveals the hottest e-commerce niches for November 2025. Each keyword represents real market demand, supported by traffic data from hundreds of active DTC brands.
Why this matters: These aren't just search trends — they're proven categories where brands are already winning. High traffic per brand = strong market validation + room to compete.
Top 10 Niches — November 2025
1. Milk Coolers
Avg Traffic/Brand: 477.6 K | Active Brands: 13
Aesthetic home appliance trend fueled by TikTok coffee culture; perfect impulse buy with high visual appeal and strong UGC potential for lifestyle content. Mylky launched 7 months ago and already generates $53K-$97K monthly revenue with just 10 products.
2. Workout Tights
Avg Traffic/Brand: 339.0 K | Active Brands: 29
Premium athleisure with proven influencer-driven demand; seasonal drops, before/after angles, and fabric innovation keep engagement high despite competition. Alo Yoga pulls 9.7M monthly visits with strong TikTok presence (564K followers) and content-led marketing.
3. Comfort Mats
Avg Traffic/Brand: 326.9 K | Active Brands: 18
Wellness meets productivity; standing desk ergonomics with clear pain-relief ROI and strong B2B crossover for corporate buyers. Muscle Mat from New Zealand demonstrates the category's profitability with $75K-$137K monthly revenue from just 6 SKUs focused on pain relief positioning.
4. AI Voice Recorders
Avg Traffic/Brand: 280.4 K | Active Brands: 13
"Work smarter" positioning with AI transcription creating new use cases monthly; strong demand from journalists, students, and professionals seeking meeting automation. HiDock shows the category's potential with 266K monthly visits and $1.3M-$2.4M annual revenue, selling premium devices ($169-$229) with clear productivity ROI.
5. Animal Rescue Merchandise
Avg Traffic/Brand: 276.0 K | Active Brands: 41
Mission-driven commerce with loyal communities; cause-based storytelling and local rescue partnerships create customer evangelists and strong LTV. The Animal Rescue Site demonstrates the category's massive potential with 11.3M monthly visits and $55M-$99.8M annual revenue—proof that purpose-driven products scale when executed well.
6. Baby Bottle Sterilizers
Avg Traffic/Brand: 265.8 K | Active Brands: 25
High-intent new parent category; UV sterilization tech + baby registry presence + safety-focused messaging drive consistent demand. GROWNSY shows how focused product lines work in baby tech—80 SKUs generating $189K-$343K monthly revenue with strong TikTok presence (653 followers) and influencer-driven growth.
7. Floodlight Cameras
Avg Traffic/Brand: 256.6 K | Active Brands: 13
Package theft concerns + smart home integration trends; visual demos and comparison content drive strong organic traffic and conversions. Lorex Technology UK, established 5 years ago, maintains steady revenue ($55K-$100K monthly) with just 52 products, proving focused catalogs work in security tech.
8. Second-hand Books
Avg Traffic/Brand: 238.3 K | Active Brands: 28
Circular economy meets BookTok culture; sustainability story + affordability + niche curation creates strong retention. French market leader La Bourse aux Livres pulls 1.17M monthly visits with $5.7M-$10.4M annual revenue from 2,000 SKUs, showing the scalability of curated used book marketplaces.
9. Egift Cards
Avg Traffic/Brand: 237.9 K | Active Brands: 52
Low-friction last-minute gifting + corporate B2B potential; instant delivery expectations and experience-based offerings drive differentiation. Sunny Go showcases the model's profitability with 166K monthly visits and $811K-$1.5M annual revenue from a 2,000-product catalog focused on experience gifts.
10. Polishing Wheels
Avg Traffic/Brand: 222.7 K | Active Brands: 15
DIY automotive restoration trend; YouTube detailing community creates consistent demand + strong bundle/kit opportunities with high intent SEO traffic. Stinger Drive proves the opportunity is still fresh—launched just 1 month ago, already hitting 34.5K monthly visits and $168K-$306K annual revenue run rate with 297 automotive accessories.
Key Insights — October 2025
Wide-open opportunity windows
57 niches have fewer than 20 brands yet maintain 100K+ average traffic per brand. That's proven demand with minimal competition—the exact sweet spot for new entrants before market saturation hits.
Low ad competition in high-traffic niches
Multiple top-performing categories show minimal active advertising (Comfort Mats: 0 active ads, Polishing Wheels: 1 active ad, Filter Holders: 2 active ads) despite strong traffic numbers. Lower paid competition = easier organic wins and lower CAC for early movers.
AI and smart tech acceleration continues
AI Voice Recorders (#4), Gaming Smartphones (#16), Gaming Tablets (#20), and Smart Home Cameras (#47) demonstrate sustained demand as AI features create new use cases and purchase triggers monthly.
Wellness and comfort products dominate
From Comfort Mats to Orthotic Shoes to Body Composition Monitors, health-focused categories show strong consumer willingness to invest in pain relief, posture, and preventive wellness—sticky categories with high repeat potential.
Mission-driven commerce thrives
Animal Rescue Merchandise (#5), Donation-based Products (#27), and Wildlife-themed Accessories (#94) prove that purpose-aligned brands capture customer loyalty and higher LTV through emotional connection and cause marketing.
Niche specialization beats broad categories
Hyper-specific products (Milk Warmers vs general baby products, AI Voice Recorders vs general electronics) consistently show higher traffic-per-brand ratios—validating the power of focused positioning over generic catalogs.
Complete Top 100 Rankings — October 2025
Data source: BrandSearch, October 2025
Methodology
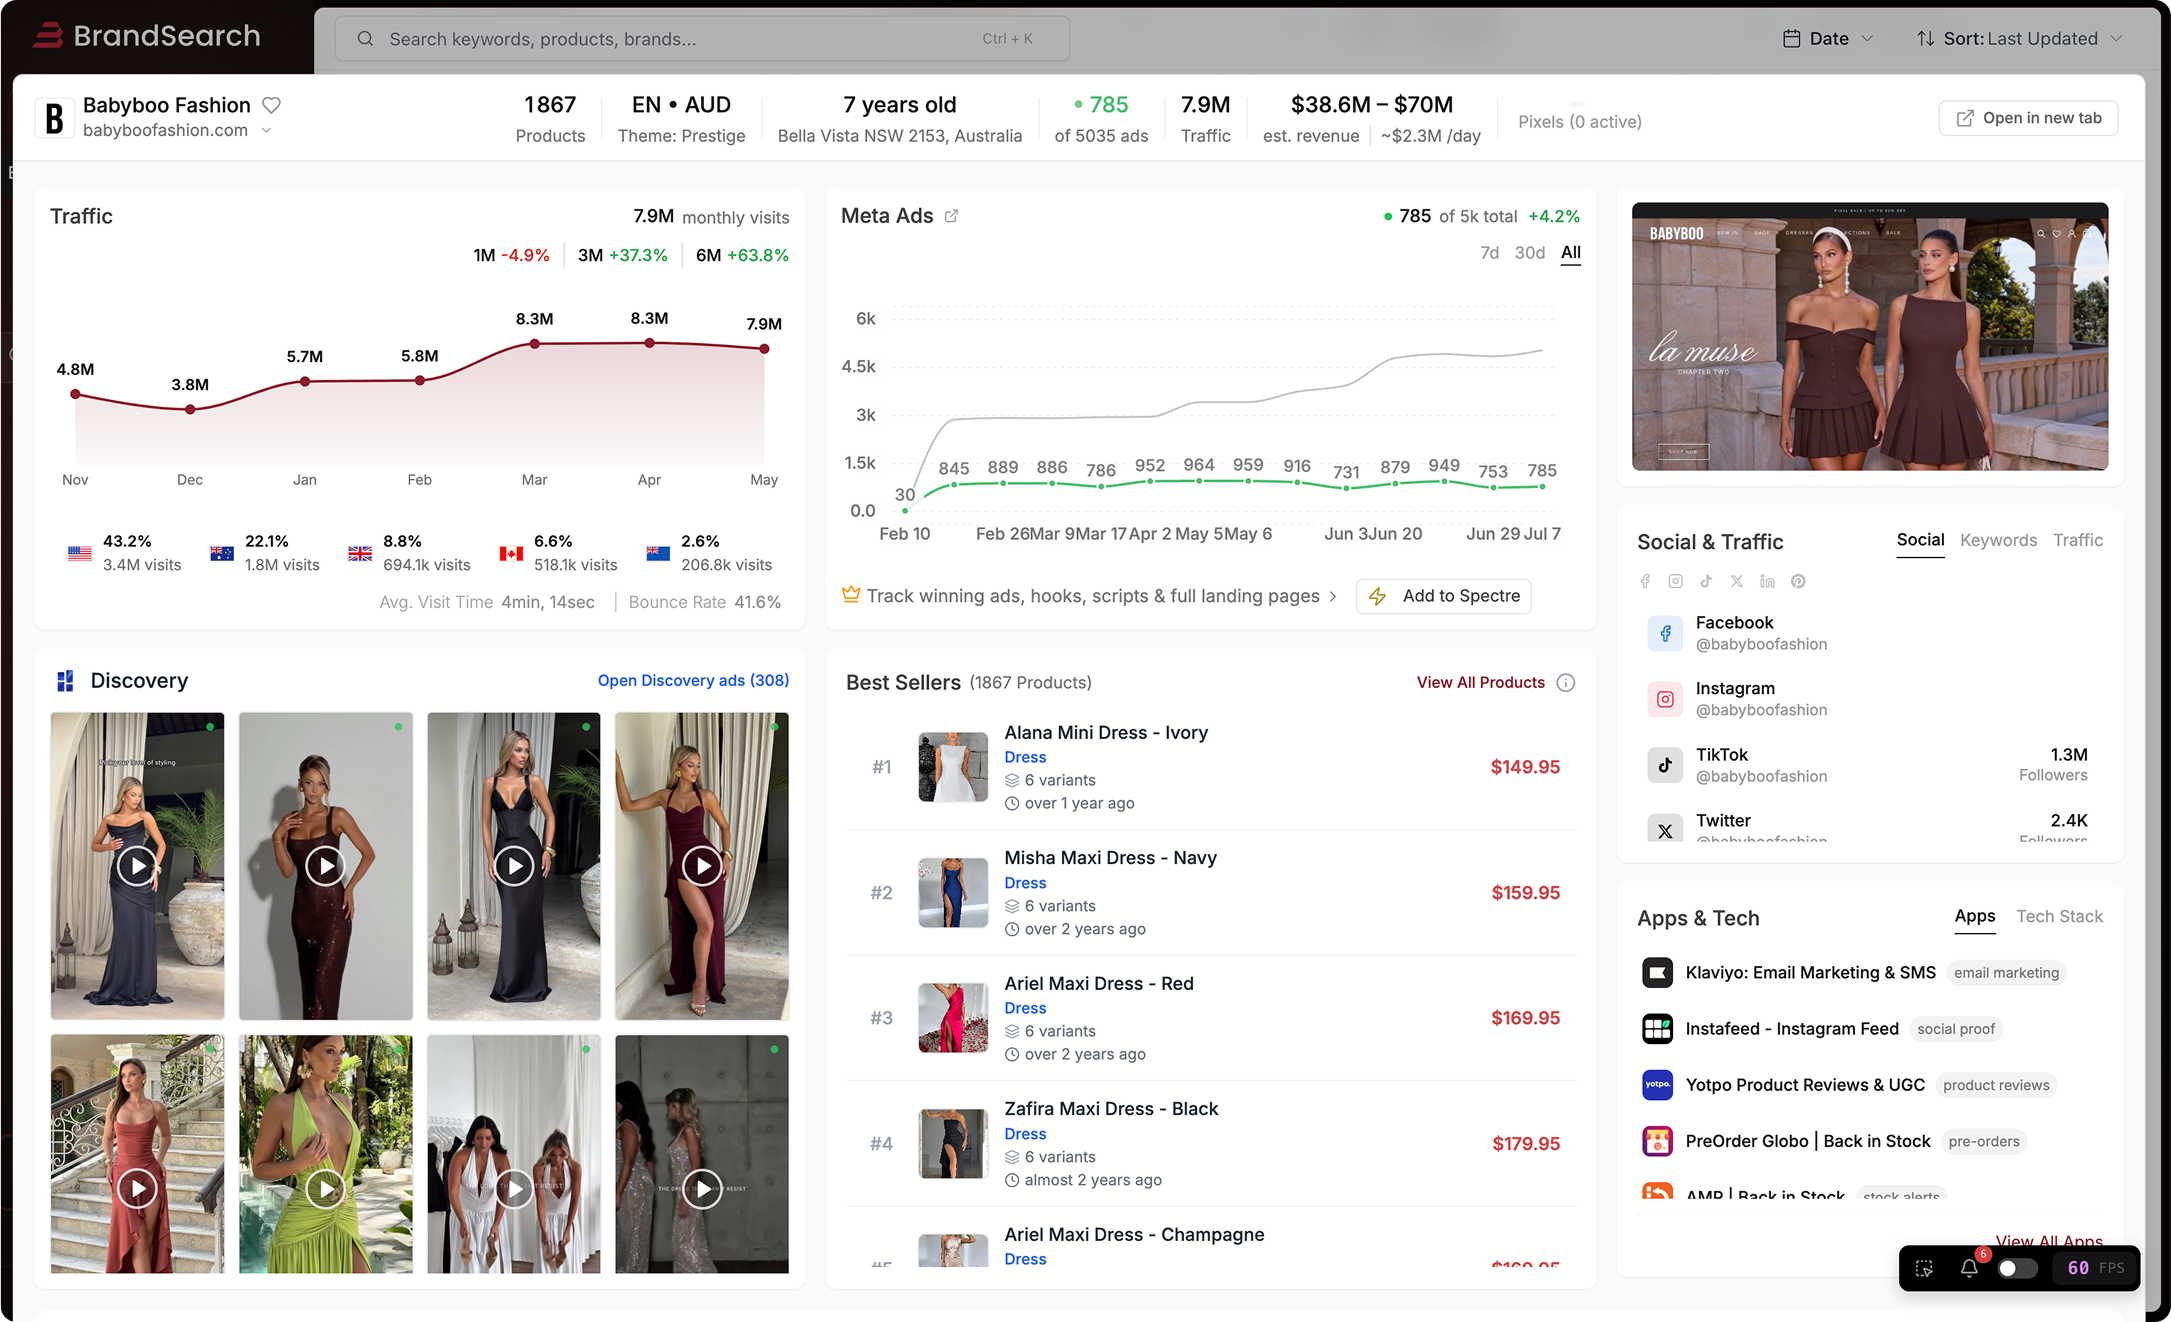
This dataset is powered by BrandSearch's proprietary eCommerce intelligence platform, which tracks:
- Real-time traffic data from thousands of Shopify and DTC brands
- Brand saturation metrics (how many active competitors per niche)
- Ad spend signals (active/total ads as demand proxy)
- Traffic efficiency ratio (avg monthly visits per brand — the #1 profitability indicator)
Each keyword represents a live product trend tracked from October 2025.
Why "Avg Traffic per Brand" matters more than total traffic:
- A niche with 10M total traffic split across 500 brands = 20K per brand (saturated)
- A niche with 2M total traffic split across 10 brands = 200K per brand (opportunity!)
We rank by efficiency, not just volume.
What You Can Do With This Data
If you're researching your next product:
- Filter for niches with <20 brands and >150K traffic
- Cross-reference with your existing skills/audience
- Check the "Win angle" insights for marketing validation
If you're already selling:
- Identify adjacent niches to expand into (e.g., Baby Bottle Sterilizers → Milk Warmers)
- Spot emerging categories before they saturate
- Validate your current niche's competitive landscape
If you're an investor/analyst:
- Track which verticals are heating up month-over-month
- Identify white-space opportunities for portfolio companies
- Benchmark brand performance against niche averages
About BrandSearch
BrandSearch is the go-to market research tool for eCommerce founders, growth marketers, and investors who need to:
✅ Discover emerging niches before saturation hits
✅ Validate product ideas with real brand traffic data
✅ Monitor competitor ads, traffic sources, and strategies
✅ Identify white-space opportunities with advanced filtering
Trusted by 15K+ DTC brands to make smarter, data-driven decisions.
Dataset generated November 14, 2025 • Analysis period: October 2025 • BrandSearch Intelligence

