🇺🇸
CrunchLabs
Toys & Hobbies
Mar 1, 20261.5Mtraffic
~$452K/day·$13.6M/mo
41active
213products
View full analysis



/Toys & Hobbies
A composite 0-to-100 score combining market concentration, visit growth and ad spend pressure. Updated monthly.
Steady mid-cycle market with room for differentiation.
The toys & hobbies niche is one of the most active categories on Shopify, with 142 stores tracked by Brandsearch. Combined, these brands generate approximately 15.8M monthly visits, with the average store pulling 111K visits per month. This page surfaces the brands actually winning right now — not yesterday's leaderboard.
Whether you are a dropshipper validating product ideas, a media buyer hunting for fresh angles, or a DTC operator benchmarking your own performance, this toys & hobbies hub gives you bestsellers, traffic trends, ad spend signals, tech stack adoption, and dominant geographic markets. Every store listed below is sortable, filterable, and linked to a full intelligence profile covering products, Meta ads, TikTok ads, growth and apps used.
Use the rankings to identify breakout toys & hobbies stores, study their marketing playbooks, and uncover the Shopify apps and integrations driving above-average growth. Combine this hub with our ad spy tool and swipe files to turn this data into a competitive workflow: from product discovery to ad creative replication.
The toys & hobbies category is updated continuously: new stores enter the index, growth signals shift, and ad spend reshuffles week over week. Bookmark this page to track the evolving landscape, or jump straight to a single brand profile to deconstruct exactly how it grew.
Leading brands in the toys & hobbies niche, sorted by traffic, revenue and growth signals.
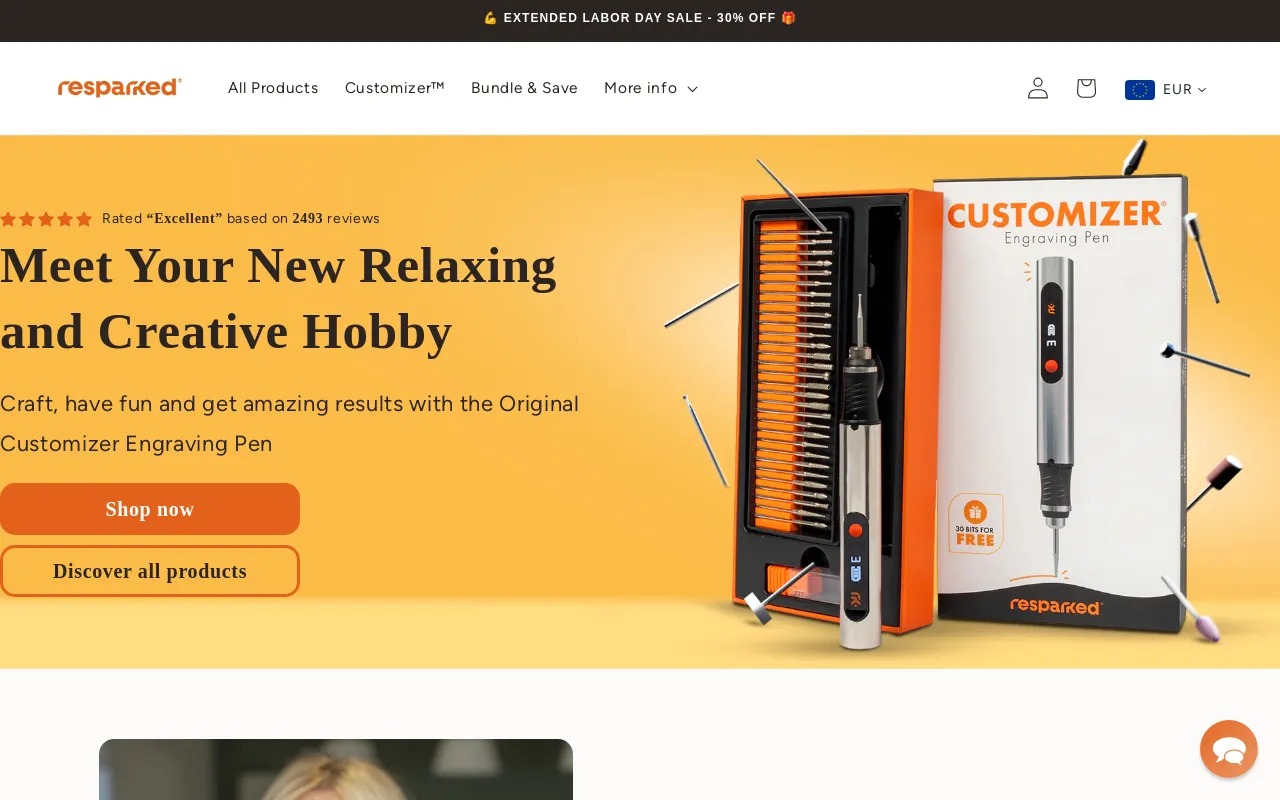
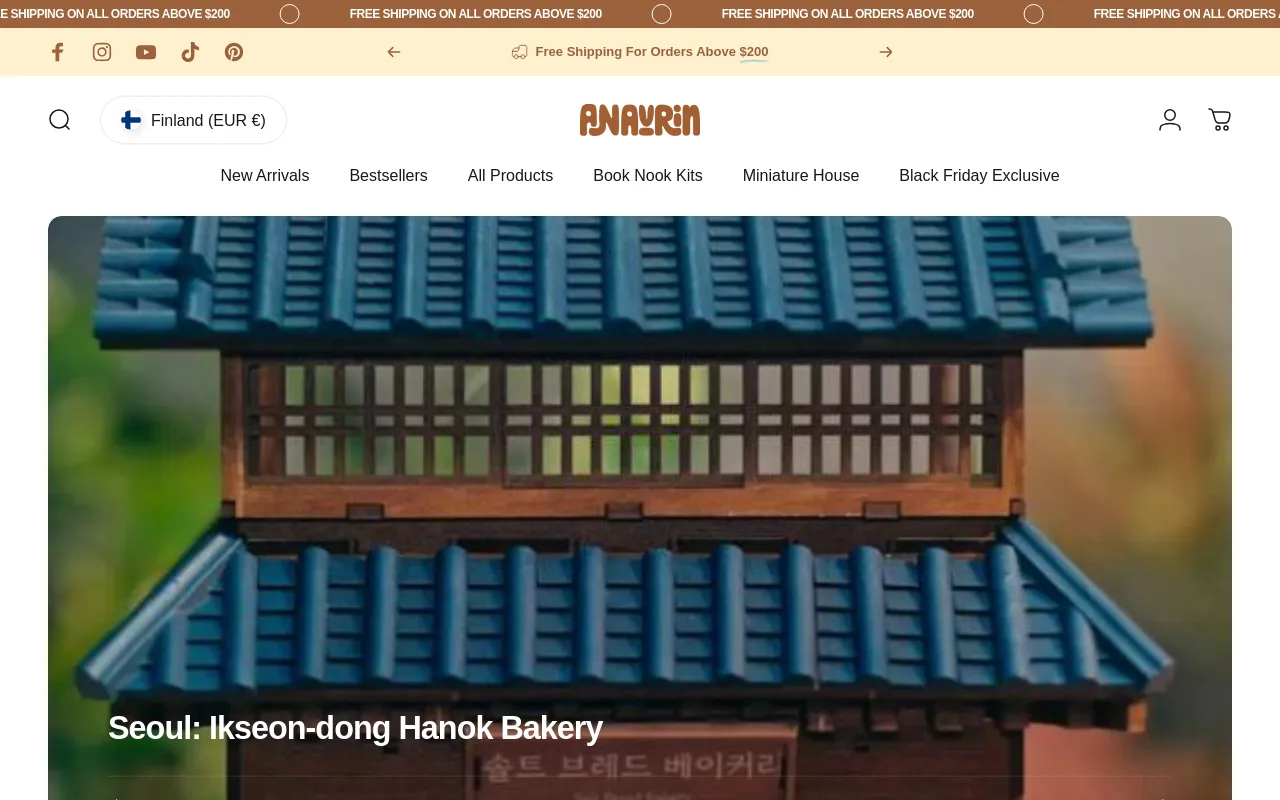
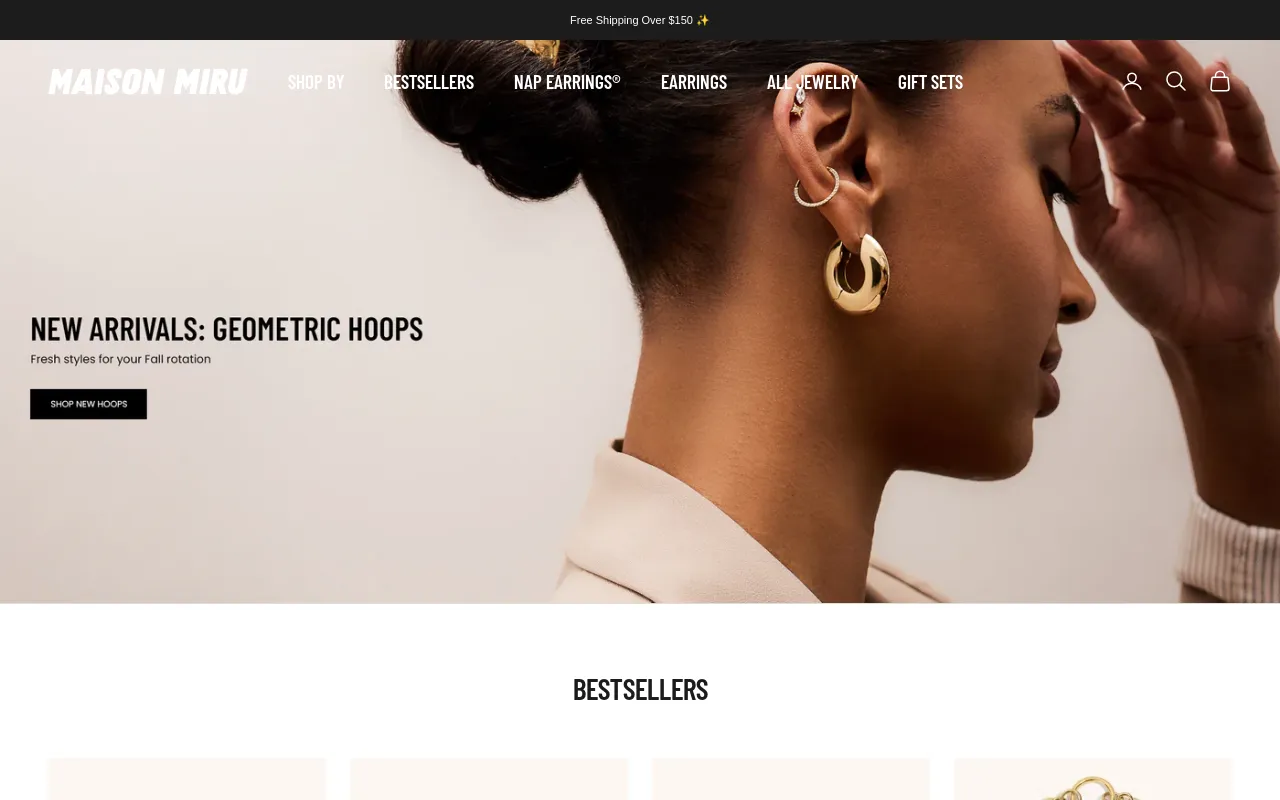
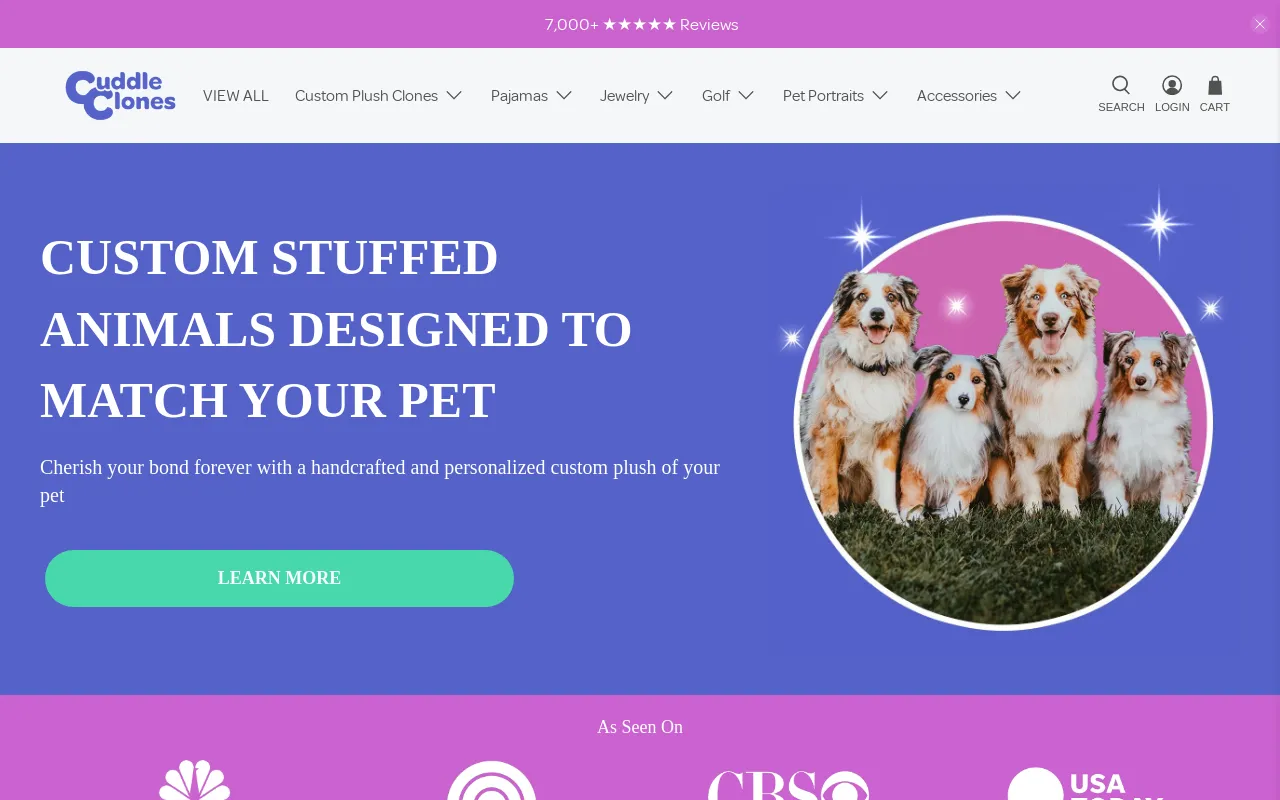
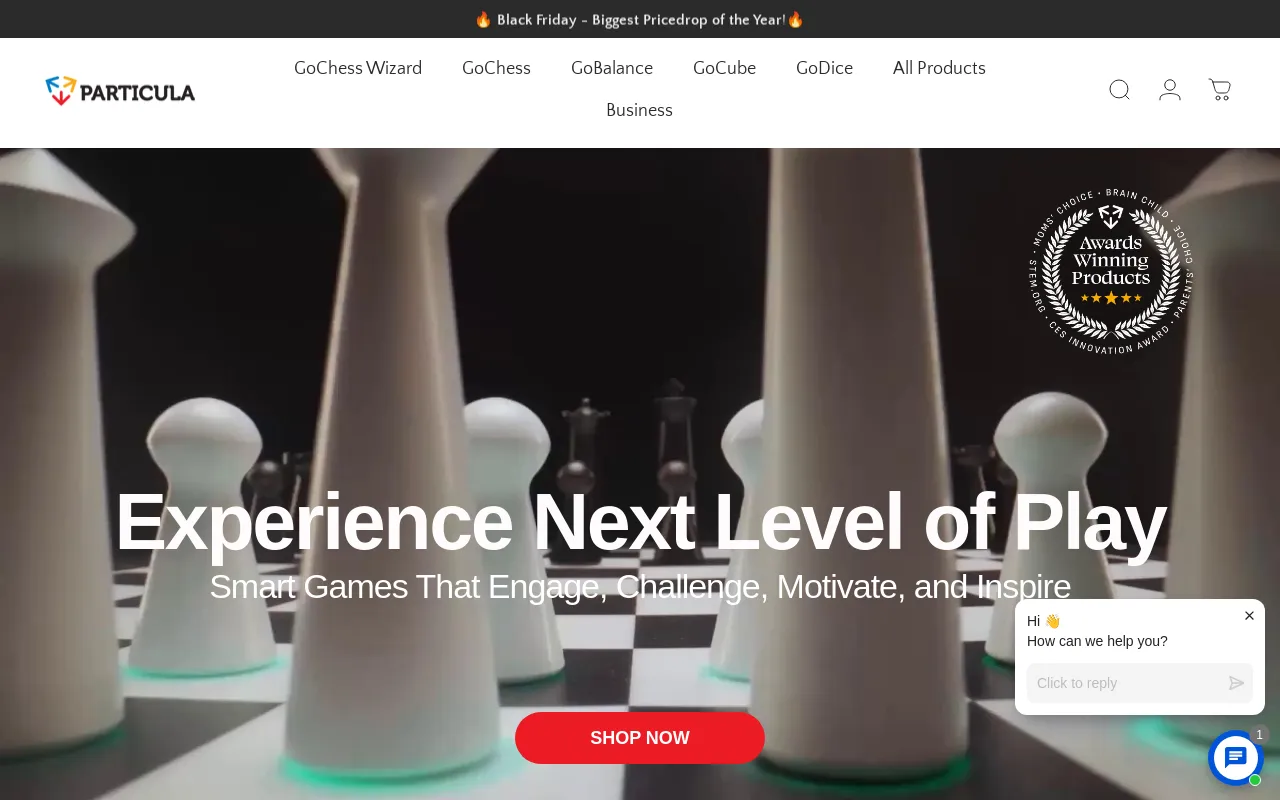
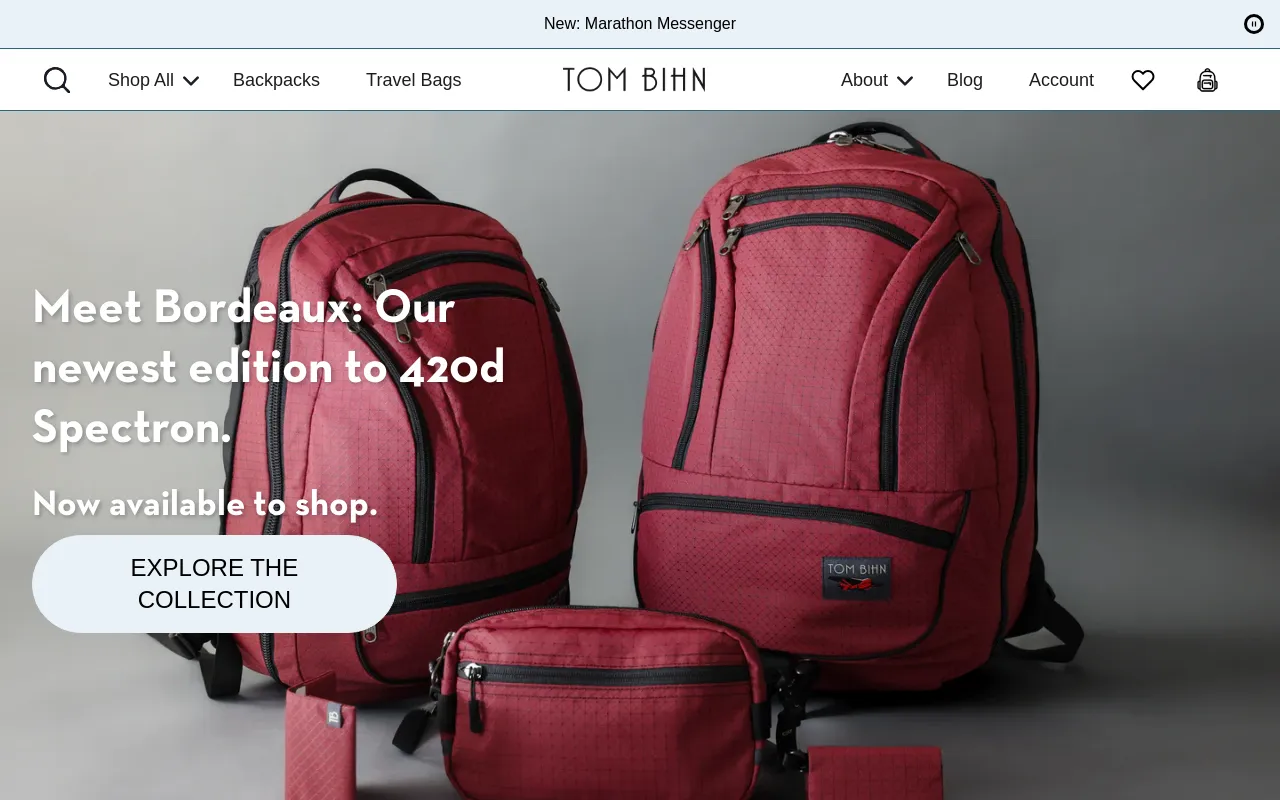
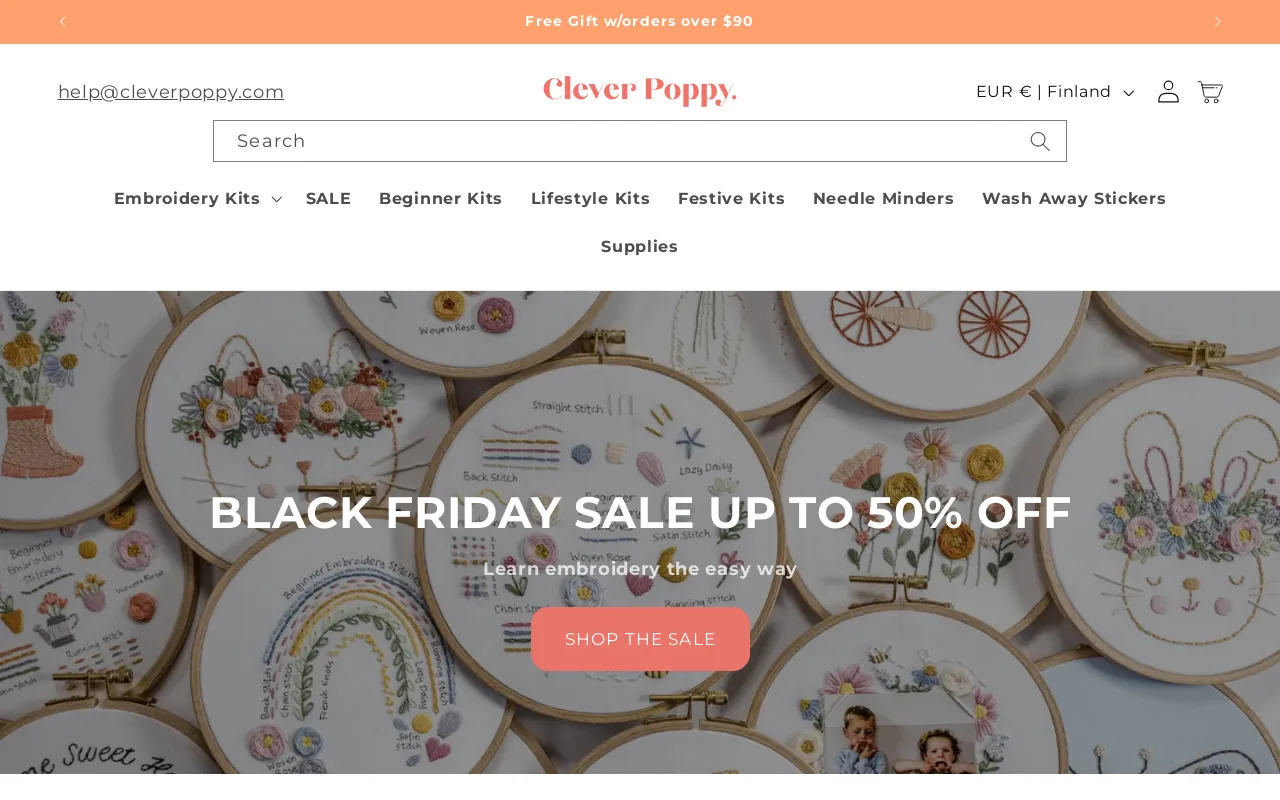
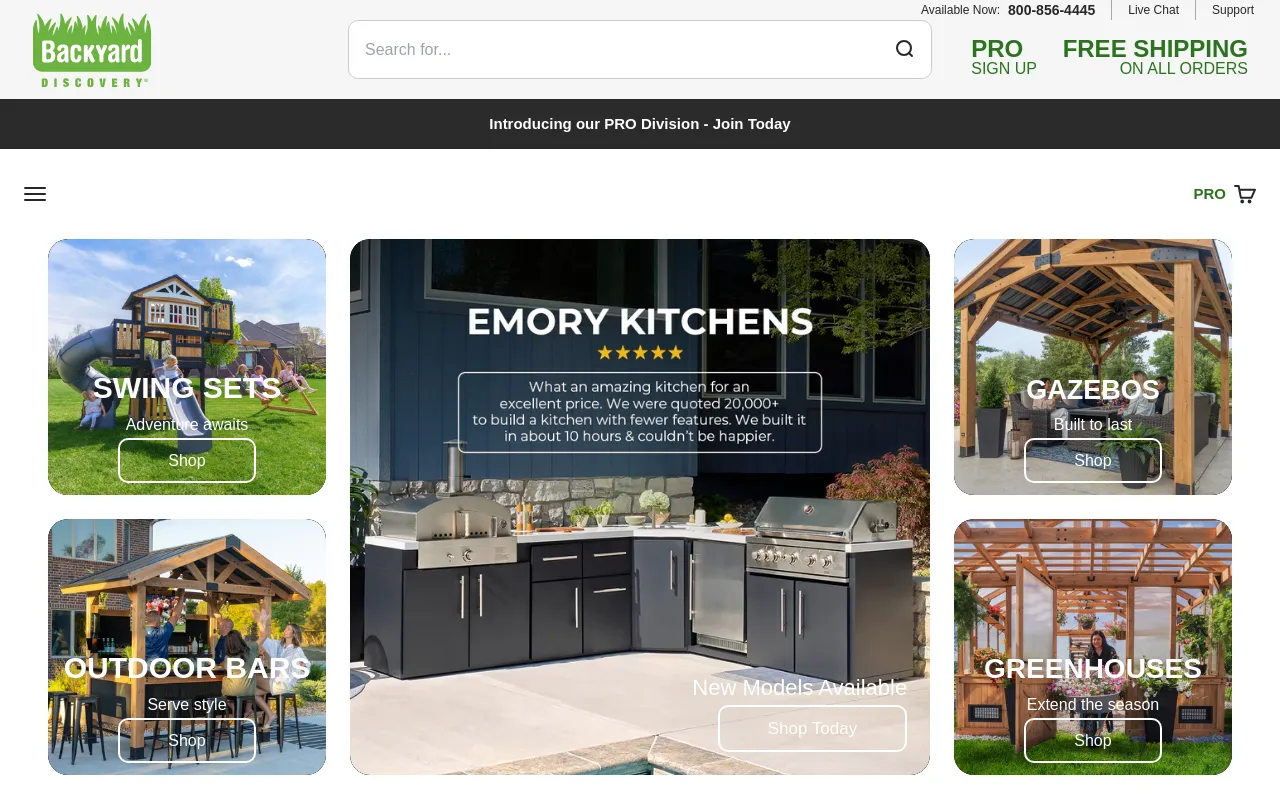
Where the toys & hobbies brands sell the most, by store count and traffic share.


Top Shopify apps powering the highest performers in the toys & hobbies niche.
Viral creatives currently scaling in the niche. Click any ad to preview the full creative.
Everything you need to know about the Toys & Hobbies niche
142+ active Shopify stores currently operate in the Toys & Hobbies niche. This represents a mature market with proven demand across multiple price points and sub-categories, ranging from indie DTC brands to scaling 7-figure operations. Use this baseline to identify market saturation, benchmark your store against the niche median, and spot underserved entry opportunities. Source: BrandSearch index of 7.5M+ Shopify stores, refreshed weekly.
The top-selling products in Toys & Hobbies are surfaced directly from bestseller signals across all 142 tracked stores. BrandSearch ranks them by adoption, recent sales velocity and inferred margin, exposing pricing sweet spots, variants, and the angle each brand uses to position the SKU. Replicating proven winners shortcuts months of trial and error compared to building product catalogs from scratch. Source: BrandSearch bestseller tracking, updated weekly.
Toys & Hobbies stores generate an average of 111,490 monthly visits, with top performers reaching 10-100× that volume. BrandSearch surfaces traffic, revenue estimates, AOV signals and growth trends per store, so you can model realistic targets at every revenue bucket. Use the niche median and 90th-percentile data to calibrate forecasts before committing ad spend. Source: BrandSearch analytics, derived from public web signals + clickstream sample.
Toys & Hobbies brands win primarily on Meta ads (Facebook + Instagram) — angles centered on UGC, before/after, scarcity offers and founder-story creatives perform best. BrandSearch's ad library exposes the exact creatives, hooks, CTAs and EU/UK spend brackets used by top performers, plus their channel mix between organic SEO, paid social, TikTok and email. Reverse-engineer 3-5 scaling competitors before crafting your own ad strategy. Source: BrandSearch Discovery + Spectre tracking, 72M+ Meta ads indexed daily.
Toys & Hobbies is a competitive but reachable niche — concentration sits with a small group of leaders while a long tail of smaller stores keeps fresh demand alive. BrandSearch quantifies saturation via competitor benchmarks, growth trends, ad-spend density and tech-stack adoption to highlight underserved sub-niches and geographic gaps. Top selling markets for this niche include US, HK, GB. Source: BrandSearch competitive intelligence, refreshed weekly.
Top toys & hobbies stores converge on a recurring tech stack — Klaviyo for email, Judge.me or Stamped for reviews, ReCharge for subscriptions where applicable, plus upsell and shipping protection apps. BrandSearch detects the full stack of each tracked store and shows adoption rates by niche, so you can copy the proven combo instead of testing apps blindly. Source: BrandSearch tech-stack detection, monthly refresh across 264+ tracked Shopify apps.
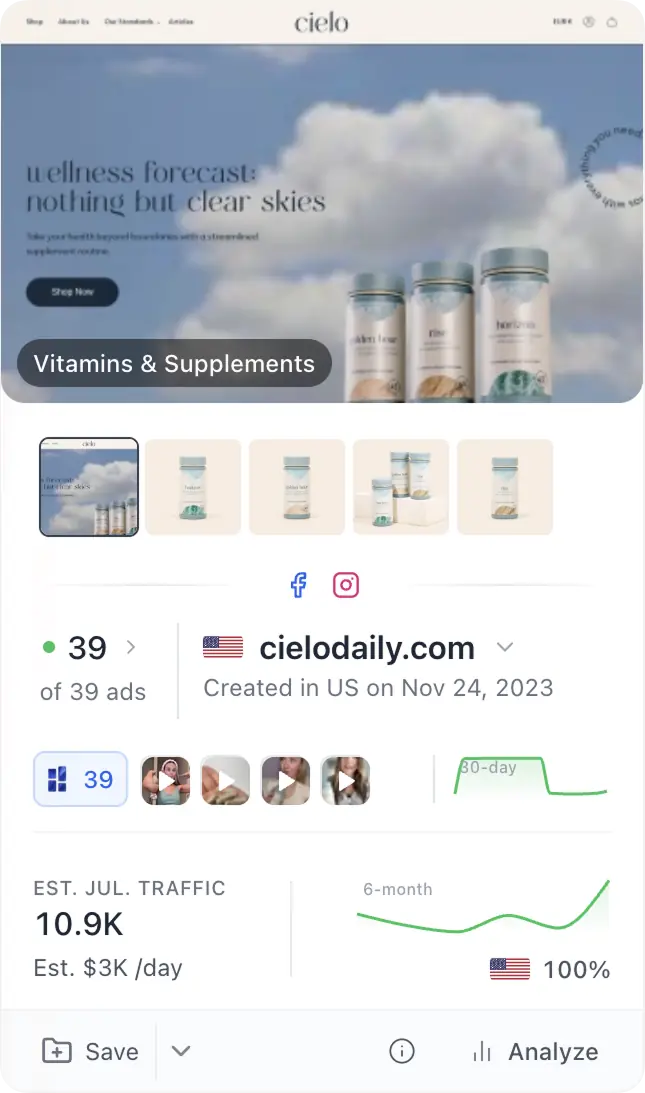
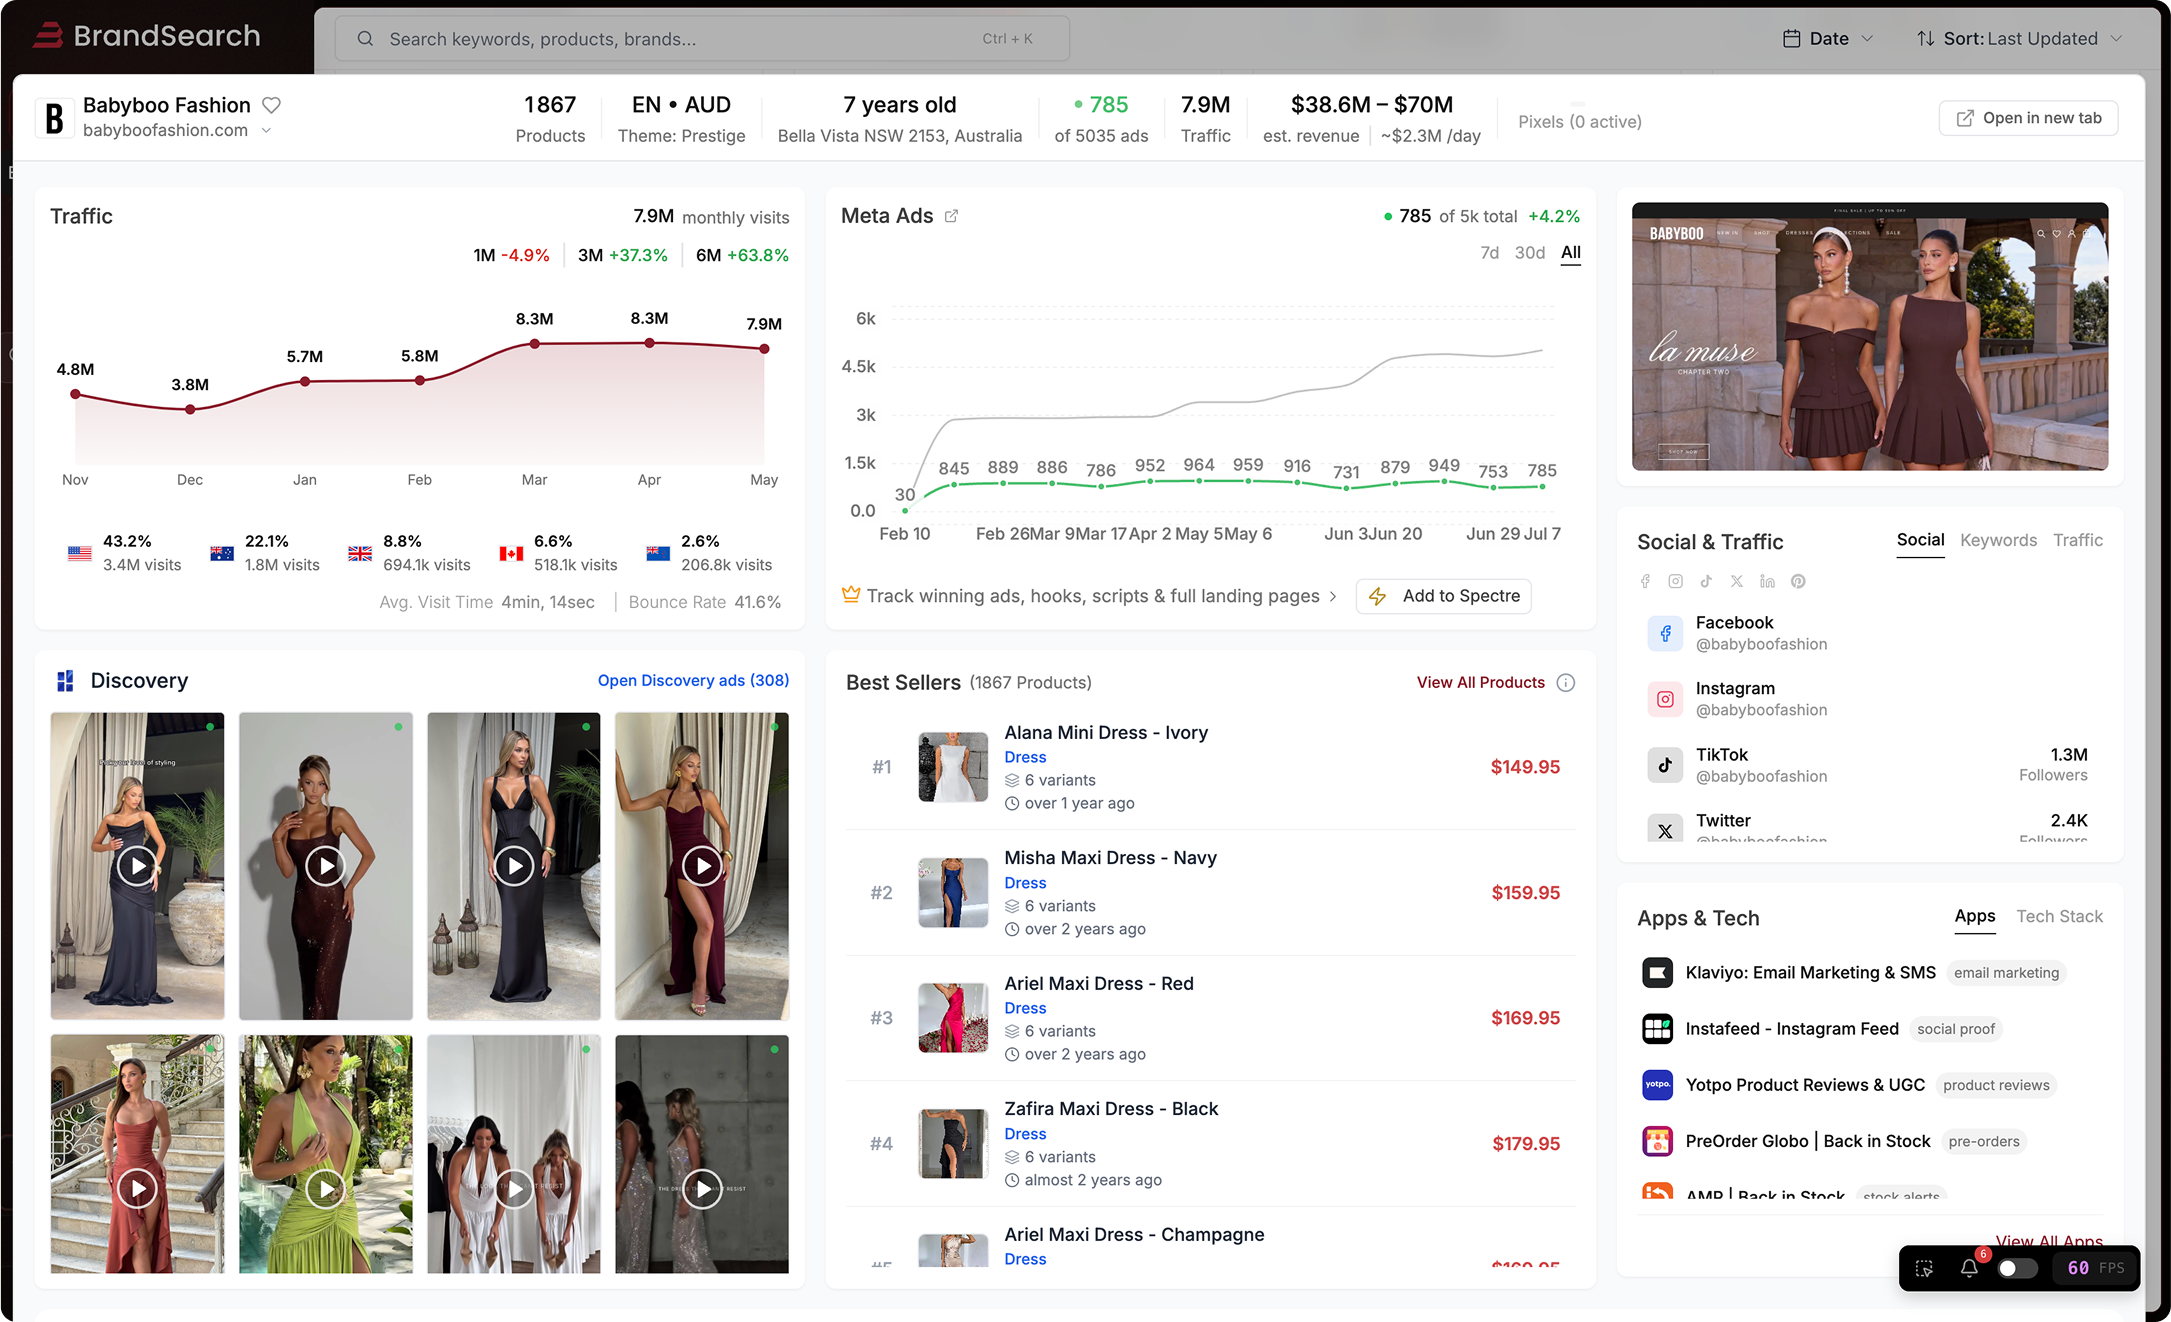
Explore every brand in the Toys & Hobbies space — their products, ad strategies, and traffic breakdown. All in one place.